A Comprehensive Guide to the Ichimoku Kinko Hyo System
Blog post description.
4/28/20264 min read
Introduction
Ichimoku Kinko Hyo, commonly known as the Ichimoku Indicator, is a comprehensive technical analysis tool used to identify trends, support and resistance levels, and potential trading signals. Developed by Goichi Hosoda, it provides a 'one glance equilibrium chart' to help traders make informed decisions.
Components of the Ichimoku Indicator
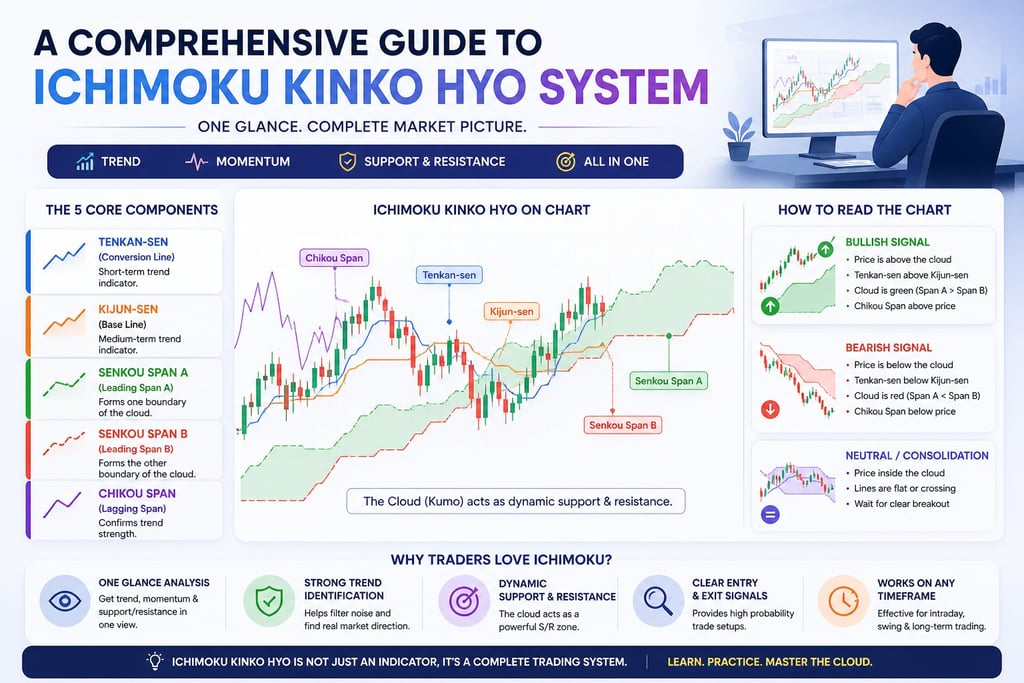
The Ichimoku Indicator consists of five main components:
• 1. Tenkan-sen (Conversion Line)
• 2. Kijun-sen (Base Line)
• 3. Senkou Span A (Leading Span A)
• 4. Senkou Span B (Leading Span B)
• 5. Chikou Span (Lagging Span)
1. Conversion Line (Tenkan-sen)
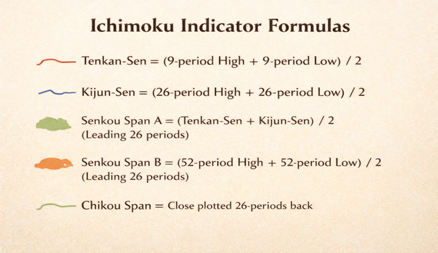
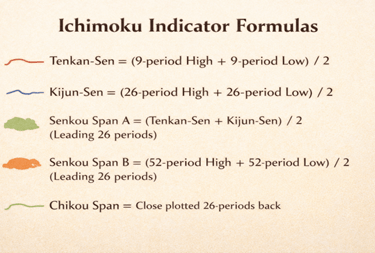
Tenkan-Sen = (9-period High + 9-period Low) / 2
The Conversion Line is a short-term trend indicator calculated as the midpoint of the highest high and lowest low over 9 periods. It reacts quickly to price changes, making it useful for spotting early momentum shifts and acting as dynamic support or resistance in trending markets.
2. Base Line (Kijun-sen)
Kijun-Sen = (26-period High + 26-period Low) / 2
The Base Line is a medium-term trend indicator representing market equilibrium and acting as a key support and resistance level. A bullish crossover — where the Conversion Line crosses above the Base Line — signals buying momentum, while a bearish cross suggests selling pressure. Price above the Base Line confirms bullish strength; below indicates bearish bias.
3. Leading Span A (Senkou Span A)
Senkou Span A = (Tenkan-Sen + Kijun-Sen) / 2 | Plotted 26 periods ahead
Leading Span A is plotted 26 periods into the future, making it a forward-looking indicator of support and resistance. As the faster boundary of the Cloud, it reacts more quickly to price changes than Leading Span B.
4. Leading Span B (Senkou Span B)
Leading Span B is the slower boundary of the Cloud. It reacts slowly to price changes, indicating stronger support and resistance. A bullish Cloud forms when Leading Span A is above Leading Span B; a bearish Cloud when it's below — helping traders anticipate potential reversals.
5. Lagging Span (Chikou Span)
Chikou Span = Current Closing Price | Plotted 26 periods into the past
The Lagging Span compares current price with historical price action. Above past prices signals an uptrend; below indicates a downtrend. It also acts as dynamic support and resistance and filters false signals by ensuring trend shifts align with history.
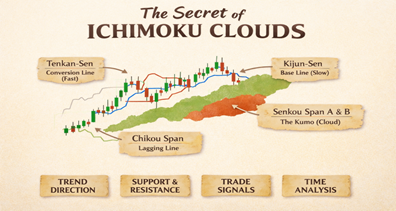
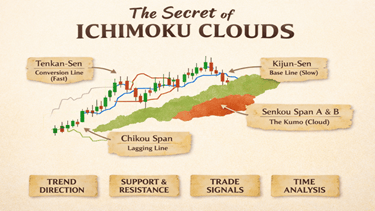
The Ichimoku Cloud (Kumo)
The space between Senkou Span A and Senkou Span B forms the Kumo (Cloud), representing support and resistance zones. A thicker Cloud indicates stronger levels; a thinner one suggests weaker ones. The angle of the Cloud also matters — a sharper angle points to a stronger trend.
How to Use the Ichimoku Indicator
• Trend Identification: Price above the Cloud = uptrend; below = downtrend.
• Support and Resistance: The Cloud acts as dynamic S/R.
• Crossovers: Tenkan-sen crossing Kijun-sen generates buy/sell signals.
• Chikou Confirmation: Confirms trend direction when aligned with price.
Trading Signals
Bullish Signal: Tenkan-sen crosses above Kijun-sen, above the Cloud.
Bearish Signal: Tenkan-sen crosses below Kijun-sen, below the Cloud.
Strong signals occur when these crossovers happen outside the Cloud.
Practical Applications and Strategies
A stock trader combining the Ichimoku Cloud with RSI spots a bullish breakout — price moves above the Cloud as RSI confirms upward momentum. The trader enters a long position with a stop just below the Cloud.
As bearish RSI divergence emerges, the stop is adjusted to breakeven, and a take-profit is set at Leading Span B. When a bearish crossover of the Conversion and Base Lines follows, along with a candle closing inside the Cloud and RSI dropping below 50, the trader exits profitably, avoiding further downside.
Live Chart Analyses
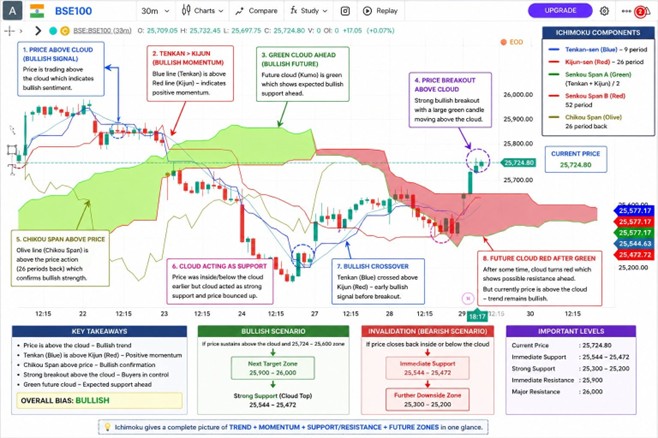
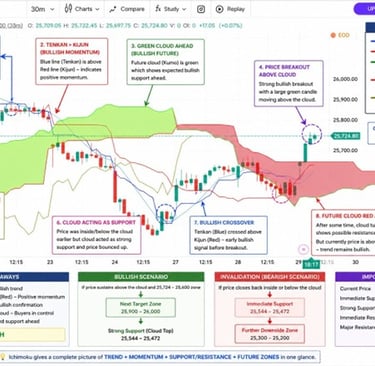
BSE100 — Bullish Setup
BSE100 (30m) showing all five bullish Ichimoku signals aligned: price above cloud, Tenkan above Kijun, Chikou above price, green future cloud, and a strong breakout candle. Overall bias: Bullish.
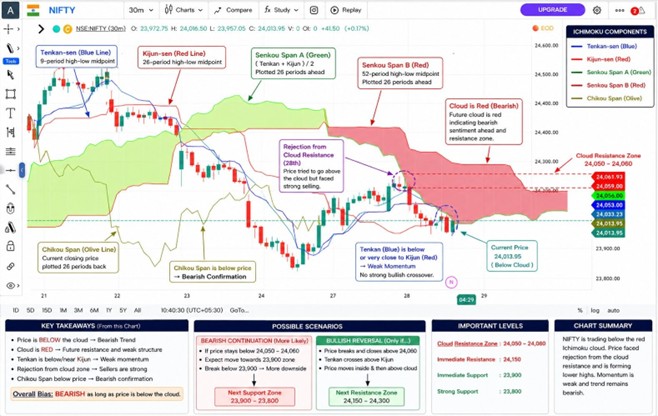
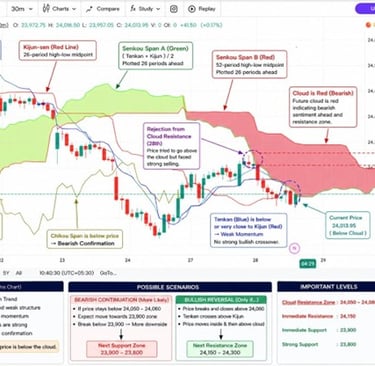
NIFTY — Bearish Structure
NIFTY (30m) trading below the red Ichimoku cloud. Price faced rejection at cloud resistance (24,050–24,060), Chikou below price confirms bearish momentum. Overall bias: Bearish.
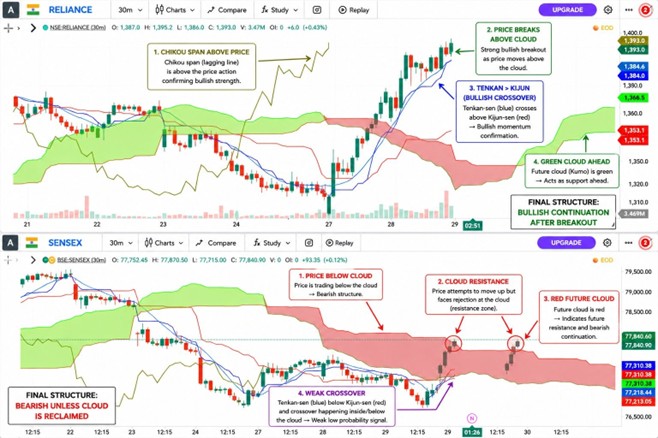
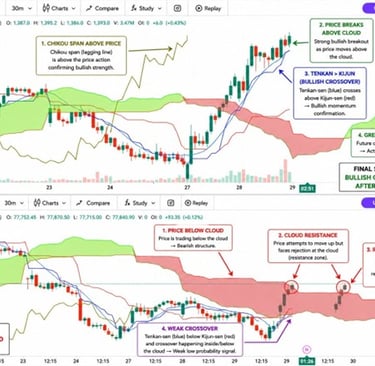
Reliance & Sensex — Diverging Signals
Top: Reliance showing bullish continuation after breakout — Chikou above price, price above cloud, Tenkan/Kijun bullish crossover, and green future cloud acting as support. Bottom: Sensex in a bearish structure with price below cloud, cloud resistance rejection, red future cloud, and a weak crossover inside the cloud.
The Bottom Line
The Ichimoku Cloud reveals trend direction, momentum, and dynamic support and resistance — and uniquely offers forward-looking information. Traders who master it can anticipate price movements, confirm trend strength, and improve trade timing for a real market edge.
Conclusion
The Ichimoku Indicator gives traders a complete view of market trends and momentum. With proper understanding and practice, it can significantly elevate your trading strategy.
© Trend Engineer | trendengineer.com