

Our Framework
Our 360° Engineering Framework
Precision-driven research shaping market insights.


Pillar 1: Technical Precision (The Momentum Engine)
The Focus: Identifying Institutional Footprints & Entry Points.
"Most traders use indicators like RSI and OBV as binary signals—overbought or oversold. At Trend Engineer, we view them as the 'pulse' of institutional activity. Our technical framework doesn't just look at price; it analyzes Volume-Price Divergence and Trend Calibration using Moving Averages. We identify the exact moment a stock shifts from 'dormant' to 'trending,' ensuring you never enter a trade without the wind at your back."
Key Metrics Taught: Advanced RSI/OBV secrets, On-Balance Volume (OBV) Secrets, Institutional Footprints.


Pillar 2: Fundamental Validation (The Business Core)
The Focus: Filtering Hype from High-Quality Assets.
"A beautiful chart is dangerous if the underlying company is weak. Our second pillar acts as a 'Quality Filter.' We remove the market noise to analyze the 'DNA' of a stock. By engineering a strict checklist around EPS Growth, P/E Ratios, and the PEG Ratio, we ensure that every technical trend we identify is backed by a robust, profit-generating machine. We don't trade tickers; we invest in engineered growth."
Key Metrics Taught:PEG Ratio, EPS Growth, and Debt Stress Testing
Pillar 3: AI-Driven Synthesis (The Decision Logic)
The Focus: Removing Human Emotion via Proprietary Logic.
"This is where 5 years of research culminates. We don't use generic AI prompts that provide 'stock summaries.' We have engineered proprietary AI logic that synthesizes our Technical and Fundamental data into a final verdict. This custom-built model cross-references the trend with the value to provide a definitive Buy, Hold, or Accumulate recommendation. It is the final layer of due diligence that makes it difficult for human bias—or market panic—to lead you astray."
Our Approach
Precision-driven insights crafted for serious investors.


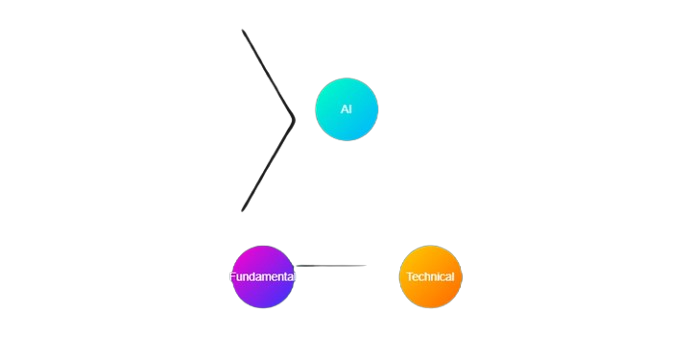
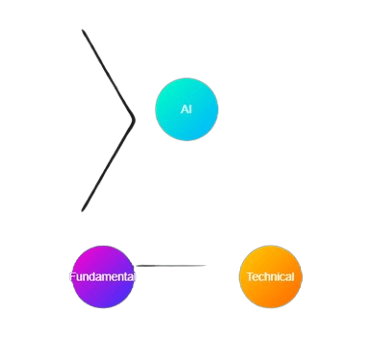
Technical
Analyzing price patterns and volume to time market moves.
Fundamental
Evaluating company health through financial data and trends.
AI-Driven
Leveraging machine learning to uncover hidden market signals.
Stock Screening
Focus only on high-quality stocks with strong momentum.
Execution & Portfolio Monitoring
Ensure investments stay aligned with changing market conditions.
Years of Research Behind the Training
This course was not created overnight. The methodology has been developed through years of research, experimentation, and observation of stock market behavior. Over a period of more than five years, hundreds of stock charts were studied to understand the characteristics that strong stocks share before they begin major price movements. Through this process, several patterns and indicators consistently appeared in successful stocks.For example, one of the screening methods identifies stocks whose monthly moving averages are greater than 20, 50, 100, and 200. Stocks that satisfy this condition often demonstrate strong long-term trends and institutional interest. Similarly, it was observed that when a stock breaks previous OBV highs over 30 days, it often signals the beginning of a new upward trend. These observations helped us design custom screeners that automatically filter stocks based on these conditions, allowing investors to focus on the strongest opportunities in the market.