Ichimoku Indicator Report
Blog post description.
4/28/20264 min read


Introduction
Ichimoku Kinko Hyo, commonly known as the Ichimoku Indicator, is a comprehensive technical analysis tool used in financial markets to identify trends, support and resistance levels, and potential trading signals. Developed by Goichi Hosoda, it provides a 'one glance equilibrium chart' to help traders make informed decisions.
Components of Ichimoku Indicator
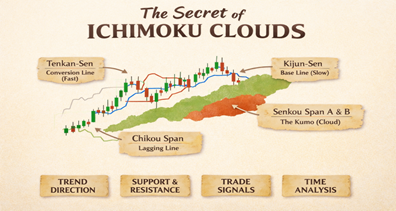
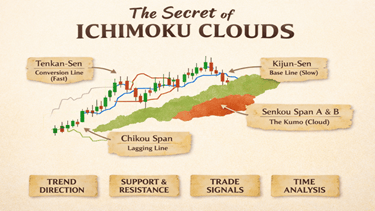
The Ichimoku Indicator consists of five main components:
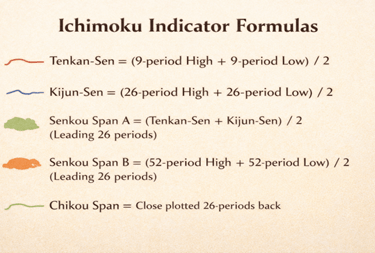
1. Tenkan-sen (Conversion Line)
2. Kijun-sen (Base Line)
3. Senkou Span A (Leading Span A)
4. Senkou Span B (Leading Span B)
5. Chikou Span (Lagging Span)
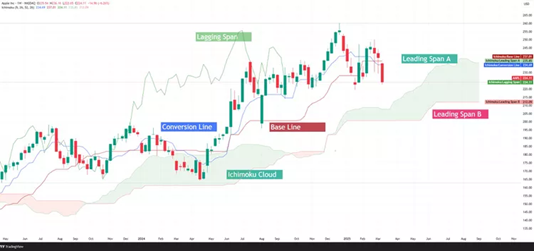
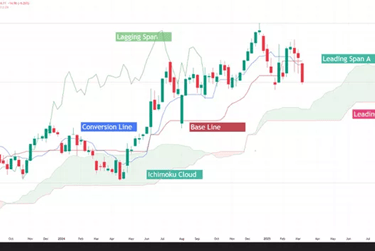
Conversion Line (Tenkan-sen)
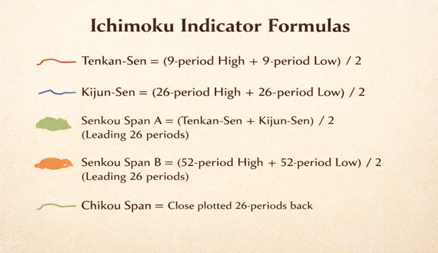
Conversion Line (Tenkan-sen) = (Highest Highn + Lowest Lown)/2
where n = 9 periods
Similar to a moving average, the Conversion Line is a short-term trend indicator, calculated as the midpoint of the highest high and the lowest low over the previous 9 periods. It reacts quickly to price changes, making it useful for spotting early momentum shifts. In trending markets, it also serves as a dynamic support or resistance level.
Base Line (Kijun-sen)
Base Line (Kijun-sen) = (Highest Highn + Lowest Lown)/2
where n = 26 periods
The Base Line is a medium-term trend indicator, calculated as the midpoint of the highest high and lowest low over the previous 26 periods, representing the market's equilibrium and acting as a key support and resistance level.
A bullish crossover, where the Conversion Line crosses above the Base Line, signals buying momentum while a bearish cross suggests selling pressure. When price remains above the Base Line, it confirms bullish strength, while trading below indicates bearish bias. Sideways movement suggests market consolidation.
Leading Span A (Senkou Span A)
Leading Span A (Senkou Span A)* = (Conversion Line + Base Line)/2
*= plotted 26 periods into the future.
Leading Span A is the midpoint of the Conversion Line and Base Line, but unlike other indicators, it is plotted 26 periods into the future, making it an indicator of future support and resistance levels. As the faster moving boundary of the Cloud, it reacts more quickly to price changes than the Leading Span B.
Leading Span B (Senkou Span B)
Leading Span B* (Senkou Span B) = (Highest Highn + Lowest Lown)/2
where n = 52 periods
*= plotted 26 periods into the future.
Leading Span B is the slower moving boundary of the Ichimoku Cloud, derived from the midpoint of the highest high and lowest low over the past 52 periods, and plotted 26 periods ahead. Due to its longer time frame, Leading Span B reacts more slowly to price changes, meaning it indicates stronger support and resistance levels.
A rising Leading Span B signals an uptrend, while a falling Span B confirms a downtrend. A bullish Cloud forms when Leading Span A is above Leading Span B. Conversely, a bearish Cloud appears when the Leading Span A is below Leading Span B. This helps traders anticipate potential reversals.
Lagging Span (Chikou Span)
Lagging Span (Chikou Span)* = Closing Price (Most Recent)
* = plotted 26 periods into the past.
The Lagging Span is a trend confirmation tool. It is calculated by plotting the current closing price 26 periods back to compare it with past price action.
If the Lagging Span is above past prices, it signals an uptrend, while below past prices indicates a downtrend. The Lagging Span is also seen as dynamic support and resistance to identify potential reversals. Additionally, it filters false signals by ensuring trend shifts align with historical price action, making it a great confirmation tool.
Ichimoku Cloud (Kumo)
The space between Senkou Span A and Senkou Span B forms the cloud, known as the Kumo. It represents support and resistance levels. A thicker cloud indicates stronger support or resistance.
Interpreting the Ichimoku Cloud
A large or thick Cloud indicates stronger support or resistance levels, while a thin one can indicate weaker support and resistance. The angle of the Cloud also contains information: as with moving averages, a sharper angle points to a stronger trend.
How to Use Ichimoku Indicator
1. Trend Identification: Price above cloud indicates uptrend; below cloud indicates downtrend.
2. Support and Resistance: The cloud acts as dynamic support and resistance.
3. Crossovers: Tenkan-sen crossing Kijun-sen gives buy/sell signals.
4. Chikou Confirmation: Confirms trend direction when aligned with price.
Trading Signals
Bullish Signal: When Tenkan-sen crosses above Kijun-sen above the cloud.
Bearish Signal: When Tenkan-sen crosses below Kijun-sen below the cloud.
Strong signals occur when these happen outside the cloud.
Practical Applications and Strategies
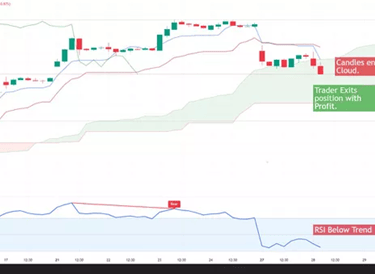
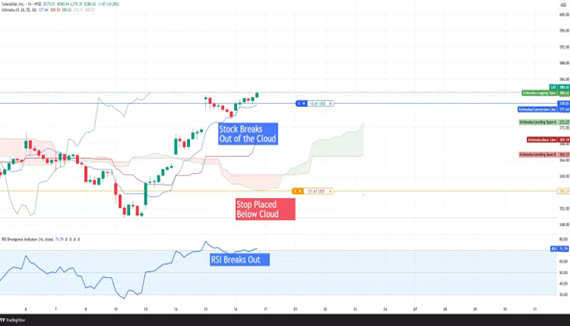
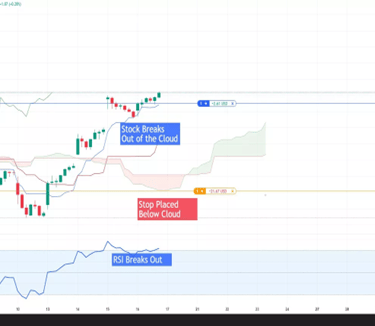
A stock trader utilizing the Ichimoku Cloud and Relative Strength Index (RSI) to capitalize on short term trends identifies a bullish breakout, as price moves above the Cloud while the RSI breaks out, confirming upward momentum. Seizing the opportunity, the trader enters a long position, placing a stop just below the Cloud.
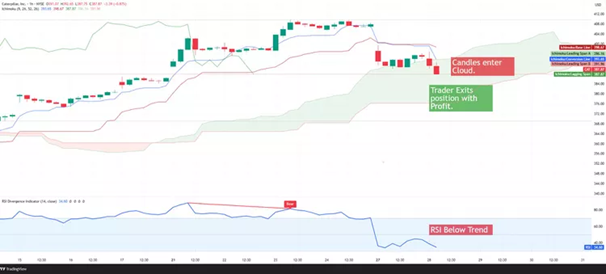
As the trade progresses, the trader observes bearish divergence in the RSI and adjusts the stop loss to break or to preserve capital. Concurrently, a take-profit order is set at Leading Span B
The trend continues to deteriorate, with a bearish crossover of the Conversion Line and the Base Line, followed by a candle closing inside the Cloud and the RSI dropping below 50, confirming loss of bullish momentum. Recognizing these trend reversal signals, the trader exits the position profitably, avoiding further downside risk.
The Bottom Line
The Ichimoku Cloud is a tool that reveals trend direction, momentum, and dynamic support and resistance levels. It is also the rare indicator that provides at least some forward-looking information. While it takes time to master, traders who can use the Cloud effectively can anticipate price movements, confirm trend strength, and improve trade timing, giving them a market edge.
Conclusion
The Ichimoku Indicator is a powerful tool for traders who want a complete view of market trends and momentum. With proper understanding and practice, it can significantly improve trading strategies.
YouTube video