On Balance Volume (OBV): The Hidden Power Behind Price Movements
When most people enter the stock market, they focus only on price whether a stock is going up or down. But experienced traders know one important truth: volume tells the real story. One of the simplest yet powerful indicators that uses volume is the On Balance Volume (OBV).
4/19/20263 min read
On Balance Volume (OBV): The Hidden Power Behind Price Movements
When most people enter the stock market, they focus only on price whether a stock is going up or down. But experienced traders know one important truth: volume tells the real story.
One of the simplest yet powerful indicators that uses volume is the On Balance Volume (OBV).
What is OBV?
OBV, or On Balance Volume, is a technical indicator that measures buying and selling pressure using volume flow.
It was developed by Joseph Granville, who believed that volume moves before price.
In simple words:
If volume is increasing → smart money is entering
If volume is decreasing → interest is fading
How OBV Works
OBV is calculated in a very simple way:
If today’s closing price is higher than yesterday → add volume
If today’s closing price is lower → subtract volume
If price is same → no change
This creates a continuous line that shows whether money is flowing into or out of a stock.
Why OBV is Important
OBV helps traders understand hidden market moves that price alone cannot show.
Key Benefits:
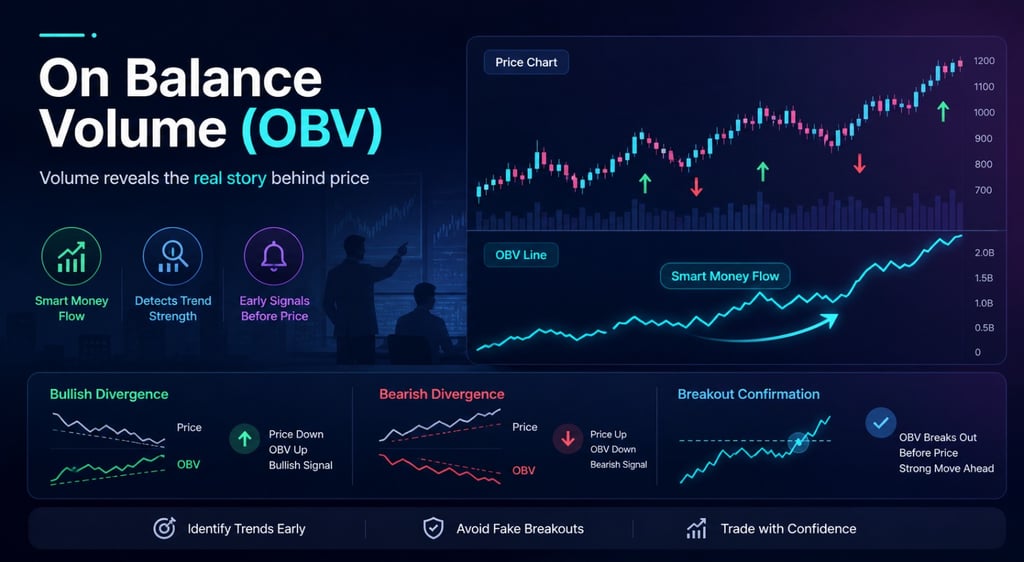
Detects trend strength
Identifies smart money activity
Gives early signals before price movement
Key OBV Strategies
1. Trend Confirmation
If price is going up and OBV is also rising → strong uptrend
If price rises but OBV is flat → weak trend
2. Divergence (Most Powerful )
This is where OBV becomes a “secret weapon”.
Price going up but OBV going down → Bearish Divergence
Price going down but OBV going up → Bullish Divergence
This often signals a trend reversal before it happens.
3. Breakout Confirmation
When OBV breaks resistance before price → big move coming soon
Hidden Insight (Advanced)
Most beginners ignore this:
OBV works best in accumulation and distribution phases
When big investors (institutions) slowly buy → OBV rises quietly
Price may not move much at first
But once buying is complete → price explodes
Limitations of OBV
No indicator is perfect.
OBV does not show exact entry/exit points
Works better with other indicators (like moving averages)
False signals in sideways markets
OBV with Real Stock Examples (Indian Market)
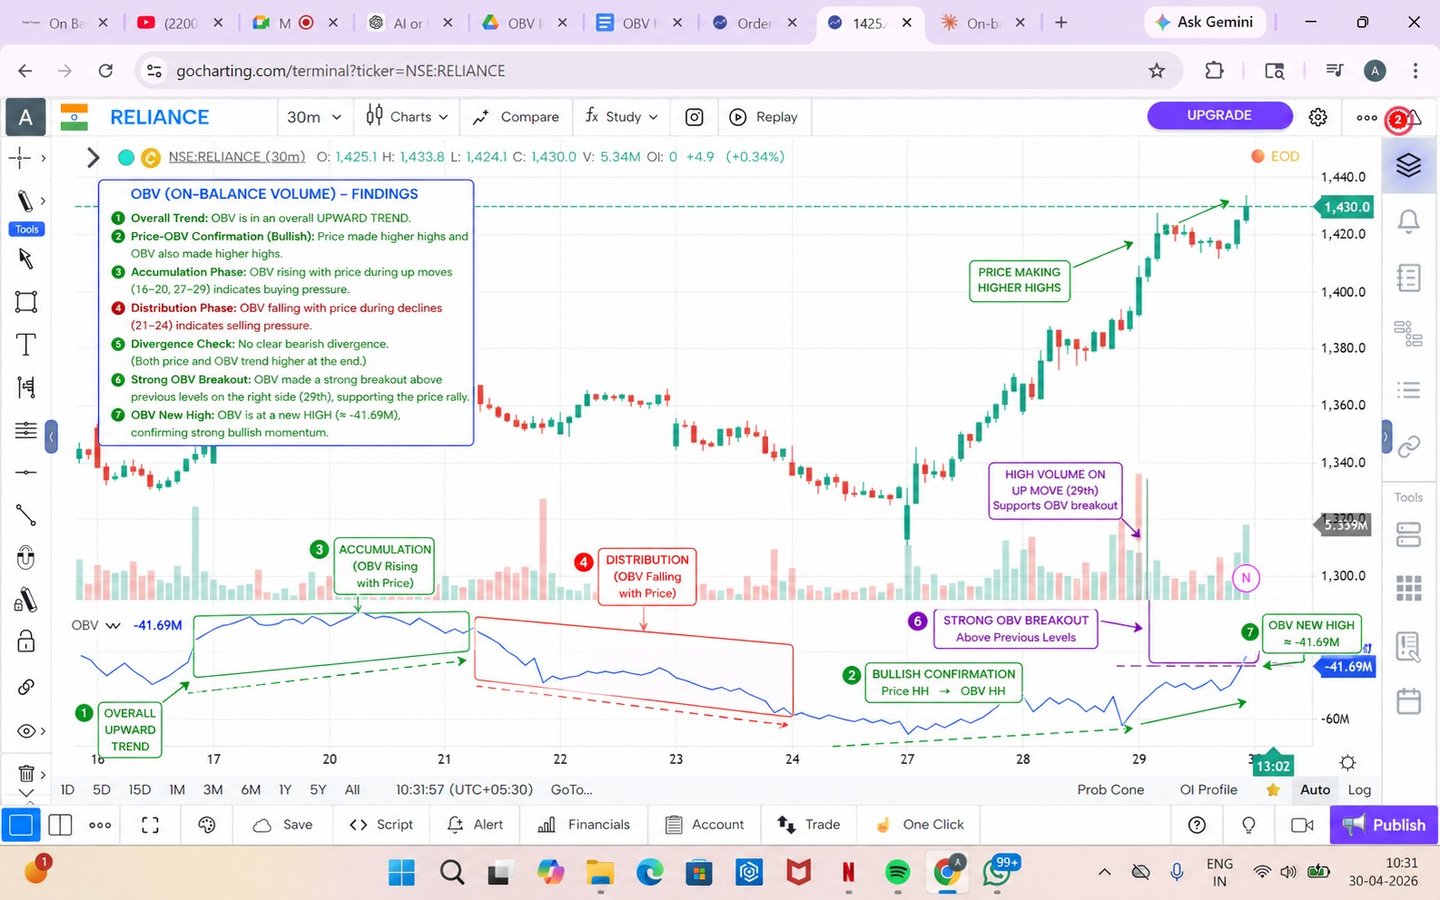
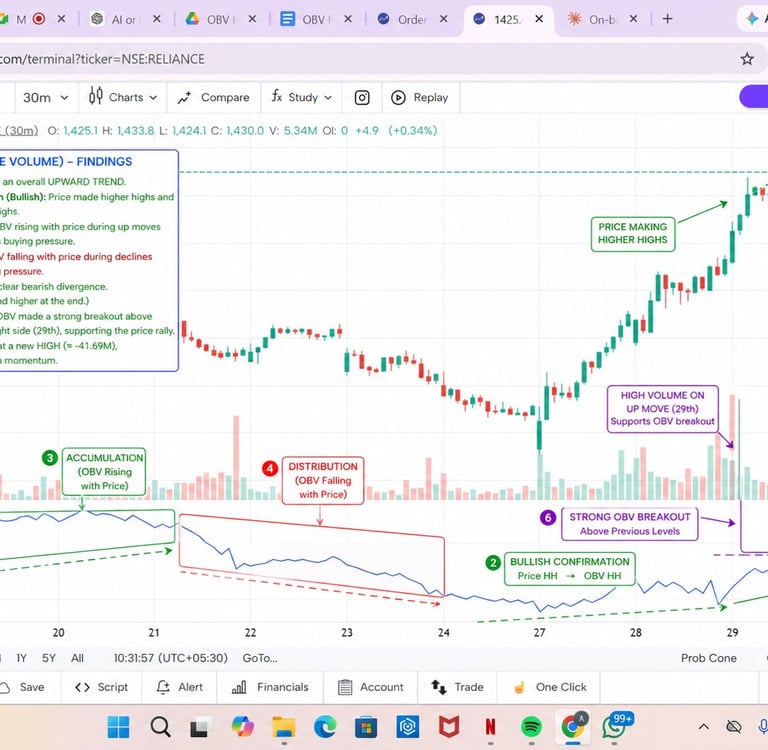
1. Reliance Industries – Accumulation Phase
Situation:
Price was moving sideways for some time
But OBV was slowly rising
What it means:
Big investors were quietly buying shares (accumulation phase)
Result:
After some time, the stock gave a strong breakout upward
Learning:
If OBV rises before price → smart money entry
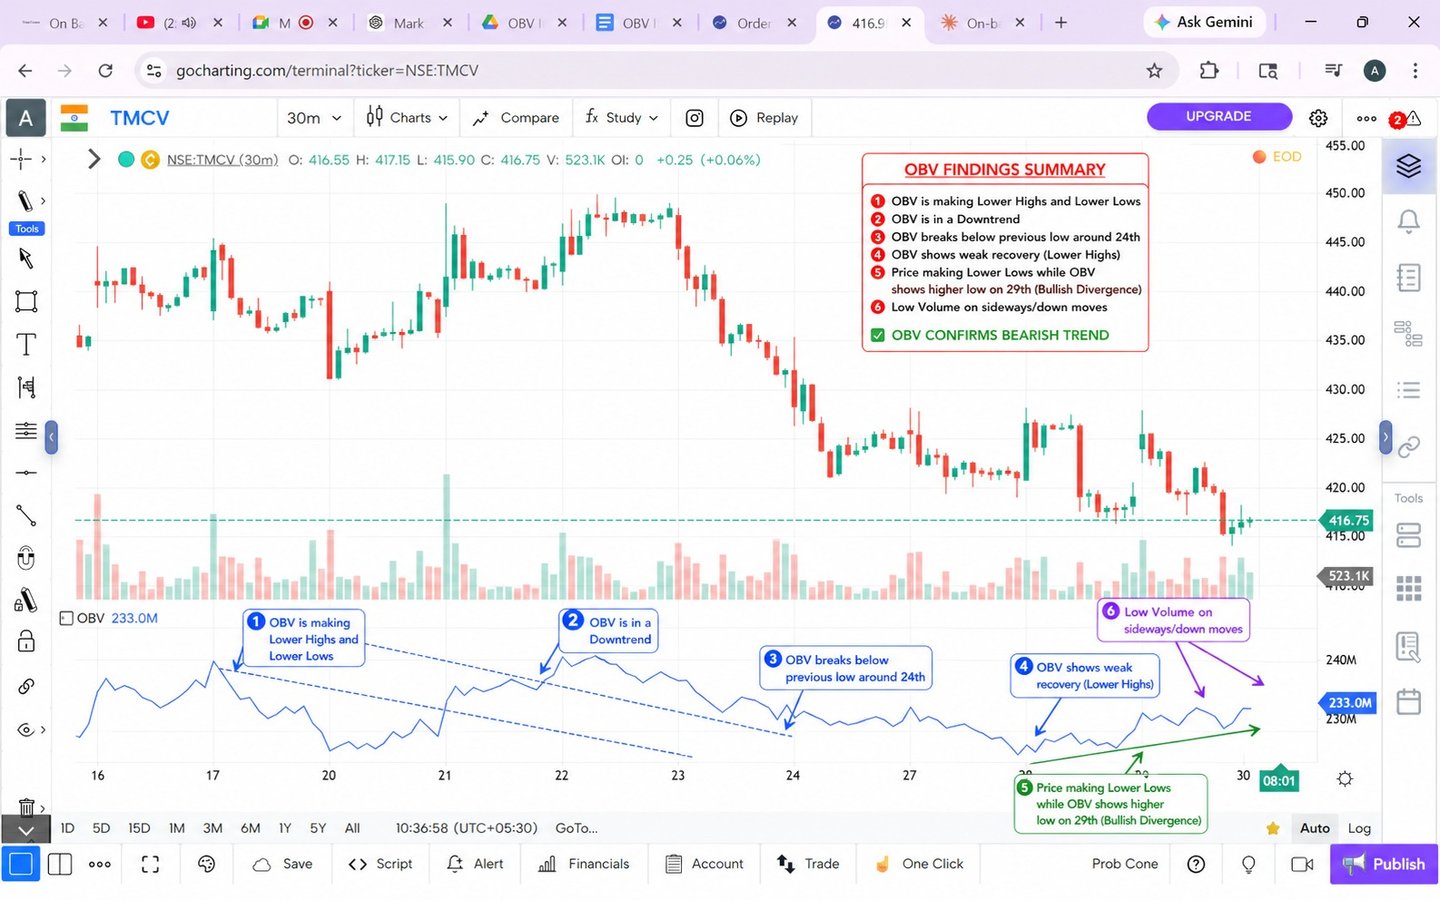
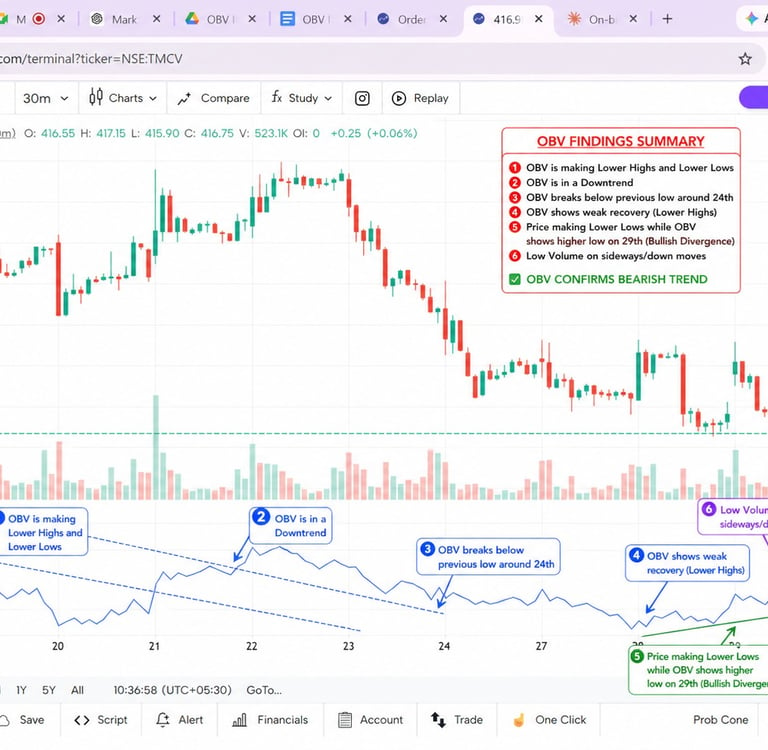
2. Tata Motors – Bullish Divergence
Situation:
Price was falling
OBV started rising
What it means:
Even though price was going down, volume showed buying interest
Result:
Stock reversed and moved upward later
Learning:
Price down + OBV up = Bullish divergence → Buy signal
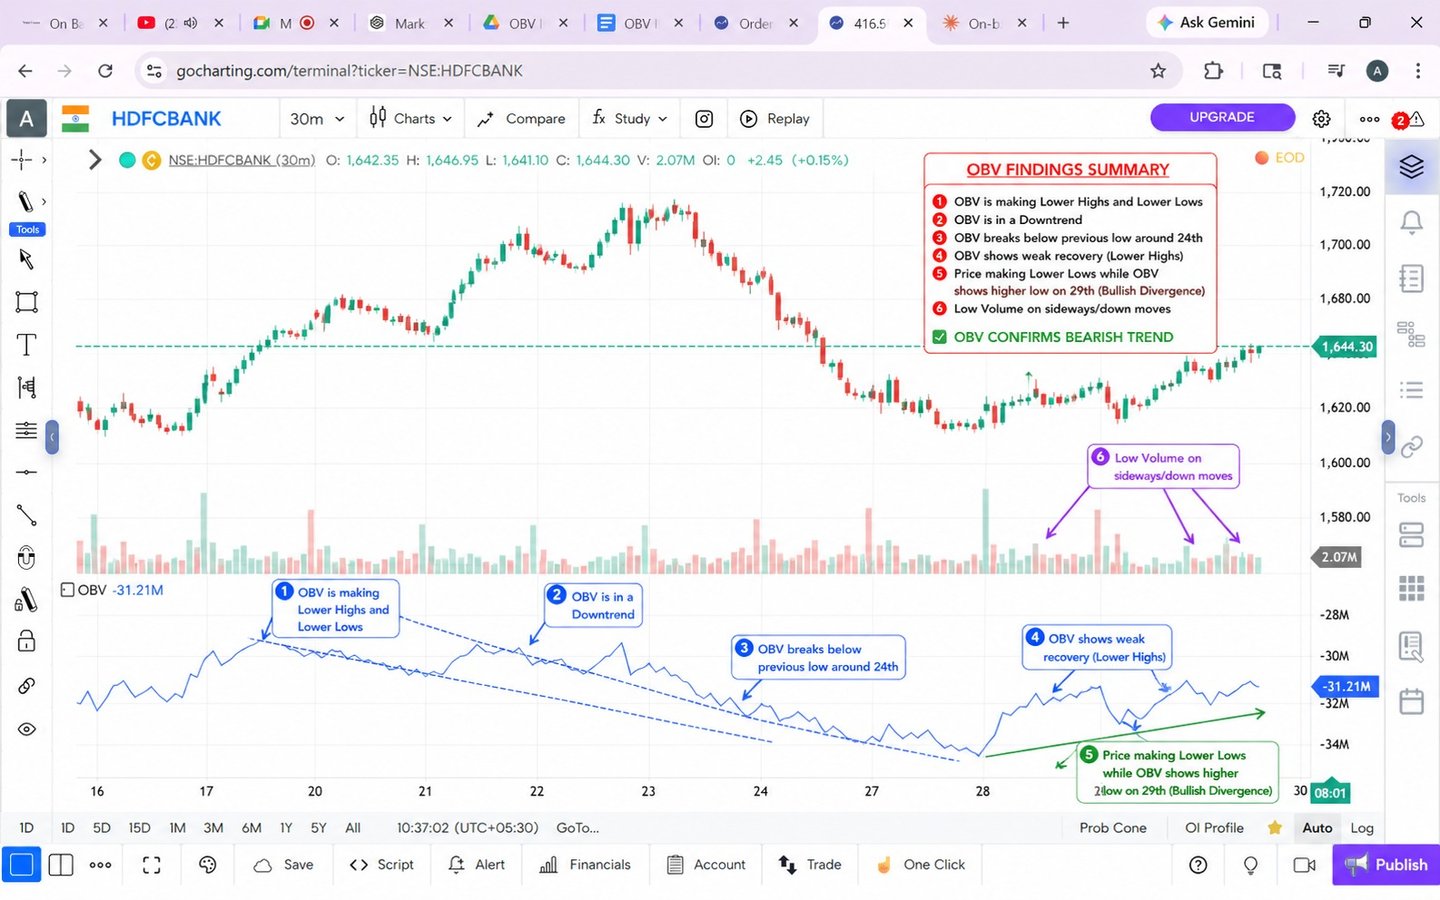
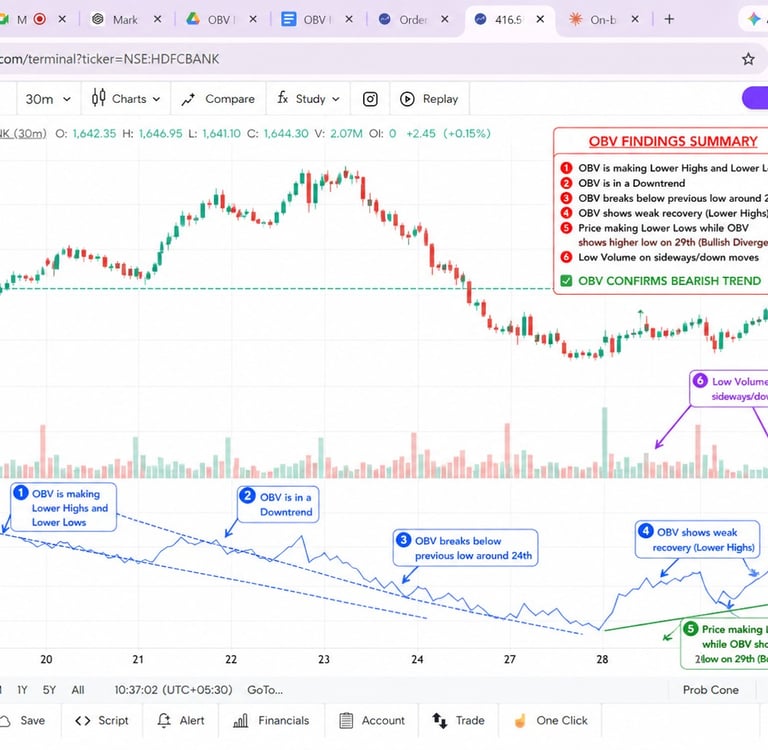
3. HDFC Bank – Weak Trend Warning
Situation:
Price was going up
OBV was flat (no strong increase)
What it means:
No strong buying support behind price
Result:
Stock slowed down / corrected
Learning:
Price up + OBV flat = weak trend
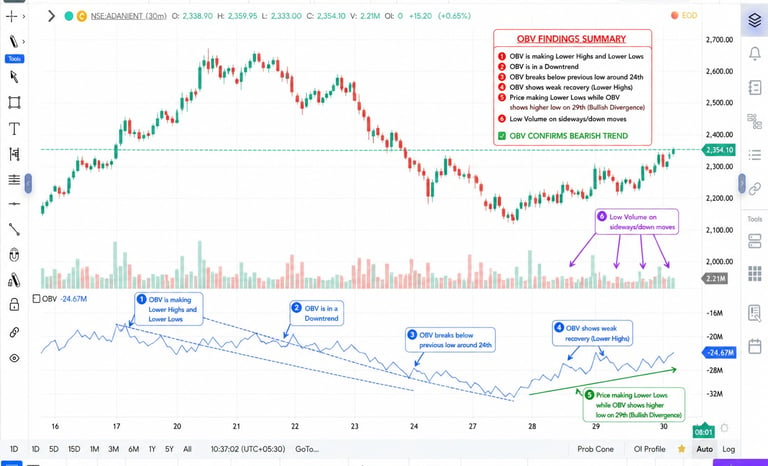
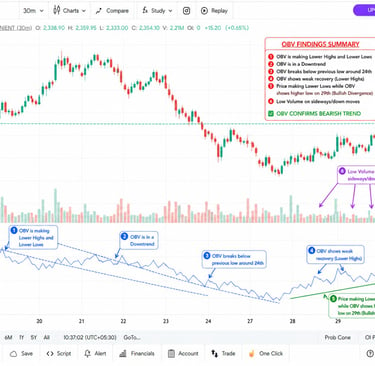
4. Adani Enterprises – Distribution Phase
Situation:
Price still going up
OBV started falling
What it means:
Big players started selling (distribution)
Result:
Sharp fall later
Learning:
Price up + OBV down = Bearish divergence → Sell warning
How to Use OBV in Indian Market (Simple Strategy)
Step 1: Identify Trend
OBV rising → bullish
OBV falling → bearish
Step 2: Look for Divergence
Opposite direction of price = early signal
Step 3: Confirm Breakout
OBV breakout first → strong move expected
Pro Tip (Used by Smart Traders)
OBV works best in:
Nifty 50 stocks
High volume stocks
Breakout setups
Avoid using OBV in:
Penny stocks
Low volume stocks
Conclusion
OBV is a simple yet powerful tool that helps you understand what big players are doing behind the scenes.
If you learn to combine OBV with price action, you can:
Spot trends early
Avoid fake breakouts
Trade with more confidence.