REPORT ON CMFI (CHAIKIN MONEY FLOW INDEX)
What is CMFI?
4/28/20267 min read
Definition
Chaikin Money Flow (CMF) is a technical analysis indicator used to measure Money Flow Volume over a set period of time. Money Flow Volume (a concept also created by Marc Chaikin) is a metric used to measure the buying and selling pressure of a security for single period. CMF then sums Money Flow Volume over a user defined look-back period. Any look-back period can be used however the most popular settings would be 20 or 21 days. Chaikin Money Flow's Value fluctuates between 1 and -1. CMF can be used as a way to further quantify changes in buying and selling pressure and can help to anticipate future changes and therefore trading opportunities.
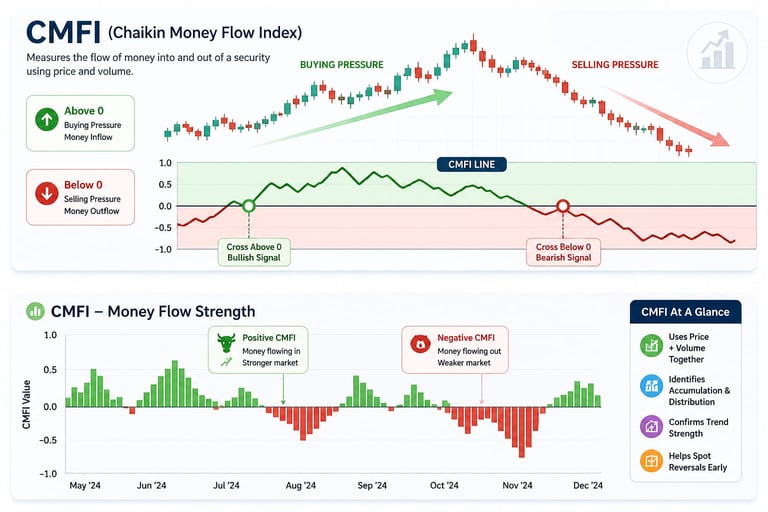
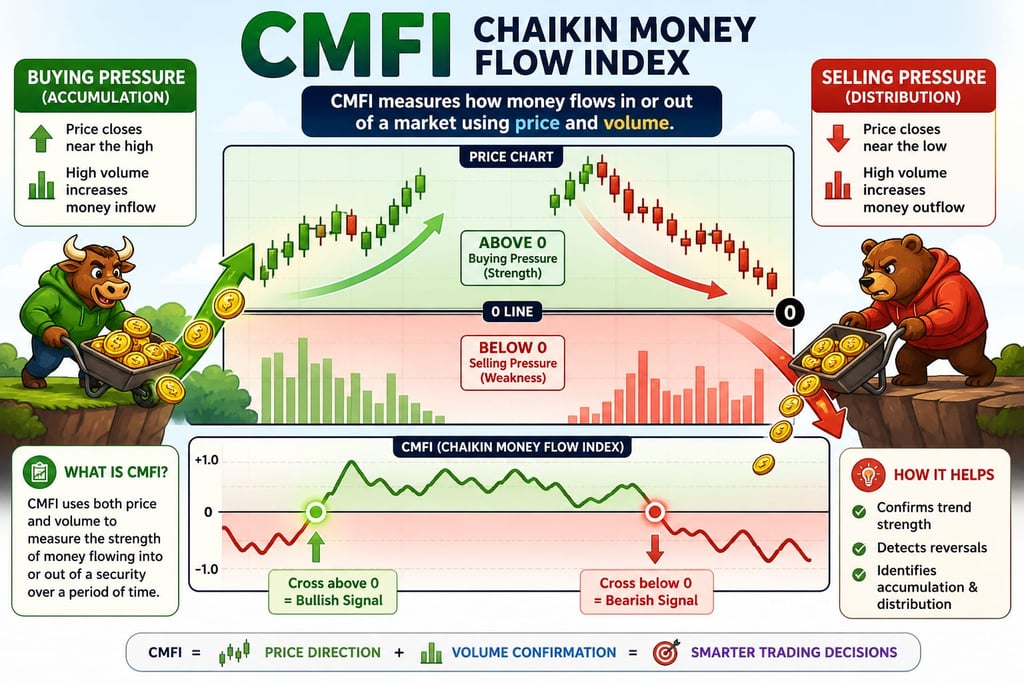
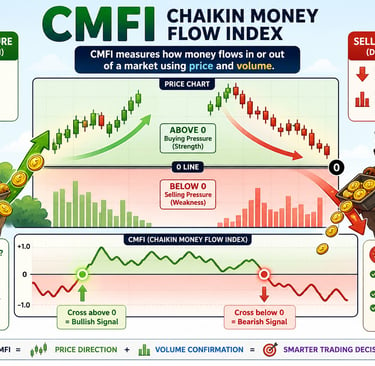
CMFI (Chaikin Money Flow Index) is a volume and price indicator developed by Marc Chaikin.
It measures how much money is flowing into or out of a stock.
Simple Meaning of CMFI
CMFI above 0 → Buying pressure (Money coming in)
CMFI below 0 → Selling pressure (Money going out)
It shows whether big investors are buying or selling.
Chaikin Money Flow (CMF) developed by Marc Chaikin is a volume-weighted average of accumulation and distribution over a specified period. The standard CMF period is 21 days. The principle behind the Chaikin Money Flow is the nearer the closing price is to the high, the more accumulation has taken place. Conversely, the nearer the closing price is to the low, the more distribution has taken place. If the price action consistently closes above the bar's midpoint on increasing volume, the Chaikin Money Flow will be positive. Conversely, if the price action consistently closes below the bar's midpoint on increasing volume, the Chaikin Money Flow will be a negative value.
How this indicator works
• A CMF value above the zero line is a sign of strength in the market, and a value below the zero line is a sign of weakness in the market.
• Wait for the CMF to confirm the breakout direction of price action through trend lines or through support and resistance lines. For example, if a price breaks upward through resistance, wait for the CMF to have a positive value to confirm the breakout direction.
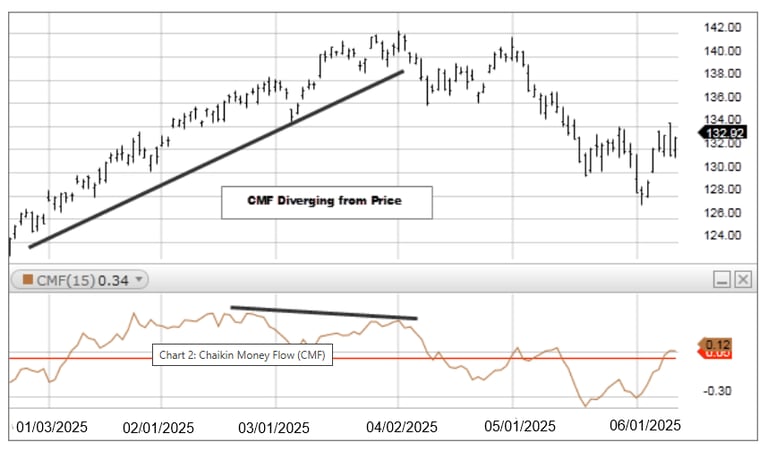
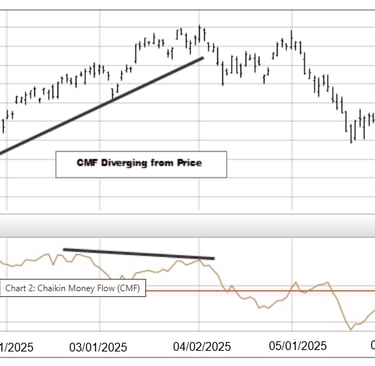
• A CMF sell signal occurs when price action develops a higher high into overbought zones, with the CMF diverging with a lower high and beginning to fall.
• A CMF buy signal occurs when price action develops a lower low into oversold zones, with the CMF diverging with a higher low and beginning to rise.
Calculation
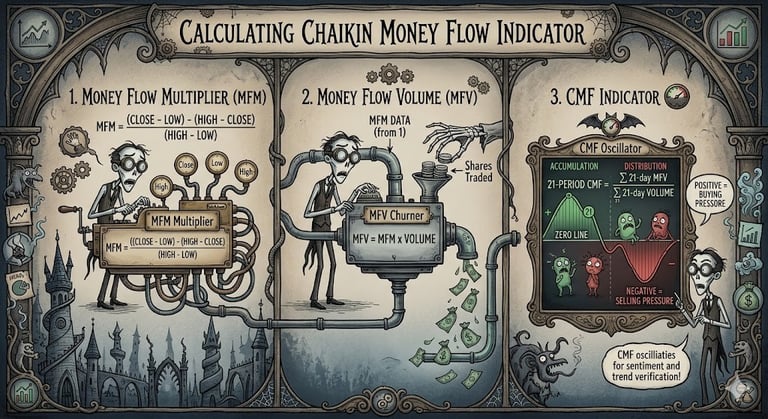
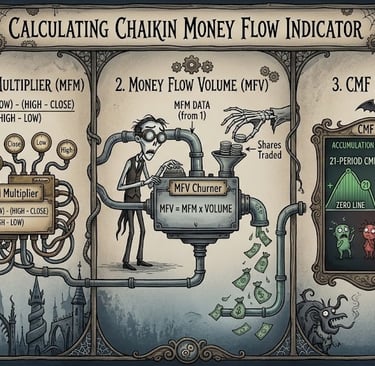
Calculating Chaikin money flow involves several steps, including finding the money flow multiplier (MFM) and money flow volume (MFV). These calculations help determine the flow of money and provide insights into the market sentiment surrounding a security.
Most charting and trading platforms offer the Chaikin money flow indicator. It’s calculated automatically, although you can customize the time period. But even if you have no interest in doing the math on your own, it’s important to see the formula, so you know why it can be effective. CMF involves three calculations:
• Money flow multiplier (MFM). Calculate the MFM as follows: ((Close value – low value) – (high value – close value)) / (high value – low value). This formula quantifies the relationship between the closing price and the trading range for the day.
The first step is to determine each period’s money flow multiplier as follows:
Money Flow Multiplier = ((Close Value – Low Value) – (High Value – Close Value)) / (High Value – Low Value)
• Money flow volume (MFV).The next step is to calculate the volume of money flow by multiplying the volume for the period by the money flow multiplier obtained in step one. It is usually calculated on a daily basis but can be figured otherwise, such as hourly or weekly. Multiply the MFM by the day’s trading volume to find the money flow volume.
• Chaikin money flow (CMF).
The last step is to calculate the CMF value. Simply divide the daily money flow over a certain period of time by the sum of volume for the same period. The default number of periods for CMF is 21 days, as this represents the trading over the past month. (There are typically 21 or 22 trading days in each month.) The formula is as follows:
CMF = 21-day Average of the Daily Money Flow / 21-day Average of the Volume
Most trading software and charting platforms include the Chaikin Money Flow indicator, so you don’t have to do the calculations yourself. Some platforms express the indicator as a decimal by dividing it by 100, while other platforms indicate it as a value between 0 and 100. A value of 0.45 on one trading platform and 45 on another platform mean the same thing.
Since the Chaikin Money Flow indicator is an oscillator, it is often represented on a chart as a histogram, similar to the MACD.
• Calculate the cumulative MFV over a specified period, such as the 21-day average of the daily MFV / 21-day average of the volume.
Various trading platforms may represent the indicator in different ways, but it has the same meaning. Some describe it as a decimal by dividing it by 100, while others express it as a value ranging from zero to 100. For instance, a reading of 0.45 on one trading platform may be shown as 45 on another platform.
How to use the Chaikin money flow indicator
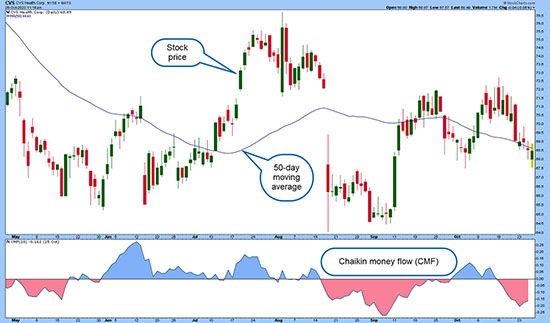
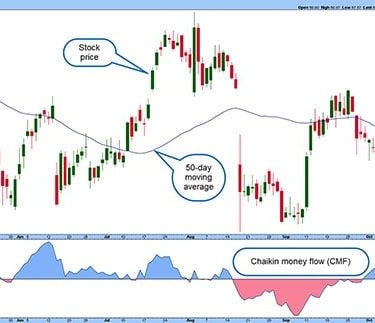
Chaikin money flow is an oscillator that measures the money flowing into an asset during a specific lookback period, typically set at 21 days. It’s usually displayed as a signal line, with values ranging from -1 to +1 (or -100 to +100, depending on the platform) with a zero line in the middle. Traders often plot the indicator below a price chart to compare its movements with price trends.
Figure 1: FOLLOW THE FLOW; FOLLOW THE PRICE ACTION.
Source: StockCharts.com. Annotations by Encyclopædia Britannica, Inc
Identify accumulation and distribution.
Chaikin money flow’s primary purpose is to distinguish between periods of accumulation and distribution of a security. When the indicator is above the zero line, it indicates the security is experiencing net accumulation, suggesting that investors are buying the asset. When the indicator is below zero, it suggests net distribution, indicating that investors are selling the asset.
Confirm trends. Chaikin money flow can be used in conjunction with other technical indicators and chart patterns to confirm the strength of trends. When the indicator is in line with the prevailing price trend, it adds credibility to the trend’s sustainability. For example, in an uptrend, a rising signal line provides validation. A declining signal line during an uptrend may suggest weakening buying pressure.
Spot overbought and oversold conditions. Similar to oscillators like the relative strength index (RSI), Chaikin money flow can help identify overbought and oversold conditions. If Chaikin money flow reaches extreme positive values, it suggests that the security may be overbought, while extreme negative values indicate potential oversold
Who uses the Chaikin money flow indicator? Does it work?
The versatility of the Chaikin money flow indicator allows for its use by a wide range of market participants, including day traders, swing traders, long-term investors, and technical analysts.
Traders often use CMF as a complementary tool to make more informed decisions when buying or selling securities. Institutional investors incorporate Chaikin money flow into their analysis to make strategic investment decisions based on market trends and liquidity.
The effectiveness of the Chaikin money flow indicator—as with many technical indicators—depends on various factors, including market conditions and the time frame of the analysis. Chaikin money flow is not a standalone indicator; it should be used in conjunction with other technical analysis tools.
• Market conditions. Chaikin money flow may work better in certain market conditions. For example, it can be more reliable in trending markets than in sideways or range-bound markets.
• Confirmation. Although Chaikin money flow can provide valuable insights, it should not be the sole basis for trading decisions. It’s important to combine it with other indicators, such as moving averages and moving average convergence divergence (MACD), to enhance its effectiveness.
Risk management. Even when using Chaikin money flow, risk management remains crucial. Traders should set stop-loss orders and have clear entry and exit strategies to mitigate potential losses.Creating image
Comparing Chaikin money flow with MACD and moving averages
Although there may be some overlap, comparing the Chaikin money flow with other popular technical indicators like MACD and moving averages reveals distinct differences in their purposes and applications.
Chaikin money flow
• Purpose: Chaikin money flow focuses on measuring the flow of money into or out of a security and identifying accumulation and distribution phases.
• Application: Chaikin money flow helps traders confirm trends, identify overbought or oversold conditions, and assess market sentiment.
Moving average convergence divergence (MACD)
• Purpose: MACD is designed to identify changes in momentum and potential trend reversals.
• Application: MACD consists of two lines—the MACD line and the signal line—which generate buy and sell signals based on their crossovers.
Moving averages
• Purpose: Moving averages smooth out price data and identify trends.
• Application: Simple moving averages and exponential moving averages are used to identify support and resistance levels, trend direction, and potential entry or exit points.
Again, it’s important to emphasize that Chaikin money flow is not ideal as a standalone indicator. So instead of taking an either/or approach, traders should look to use Chaikin money flow in conjunction with other technical indicators to confirm its signals.
The bottom line
Chaikin money flow is a versatile technical indicator that’s useful for identifying trends, confirming their strength, and analyzing market sentiment. CMF’s effectiveness depends on market conditions, and it should be used in conjunction with other technical analysis tools. Its broad applications mean that many market participants—from day traders to long-term investors to institutional investors—may find Chaikin money flow valuable in helping to inform their strategic investment decisions.The Chaikin Money Flow indicator is predominantly used as a tool to help gauge the strength of a trend. It is not a trading system designed to provide stop-loss points or pinpoint entry and exit prices. Therefore, traders typically use it in combination with other technical indicators that can provide further information.