The Ultimate Beginner’s Guide to Bollinger Bands
Have you ever looked at a stock chart and felt like you were staring at messy spaghetti? You’re not alone. The lines jump up and down, and it's hard to tell what’s actually happening. Welcome to Bollinger Bands. Think of this indicator as your financial GPS. It doesn’t tell you exactly where the price is going, but it shows you the boundaries of the road, helping you avoid driving into a ditch. This guide will teach you how to read these bands and use them to make smarter decisions.
4/19/20263 min read
The Ultimate Beginner’s Guide to Bollinger Bands
Have you ever looked at a stock chart and felt like you were staring at messy spaghetti? You’re not alone. The lines jump up and down, and it's hard to tell what’s actually happening.
Welcome to Bollinger Bands. Think of this indicator as your financial GPS. It doesn’t tell you exactly where the price is going, but it shows you the boundaries of the road, helping you avoid driving into a ditch.
This guide will teach you how to read these bands and use them to make smarter decisions.
1. What Are Bollinger Bands? (The Road Analogy)
Imagine you are watching a rubber band stretched around a moving ball. As the ball bounces faster and wilder, the rubber band stretches wider. When the ball calms down, the rubber band relaxes.
Bollinger Bands do exactly that for stock prices. They are a "volatility indicator." Volatility is just a fancy word for how crazy or calm the price is moving.
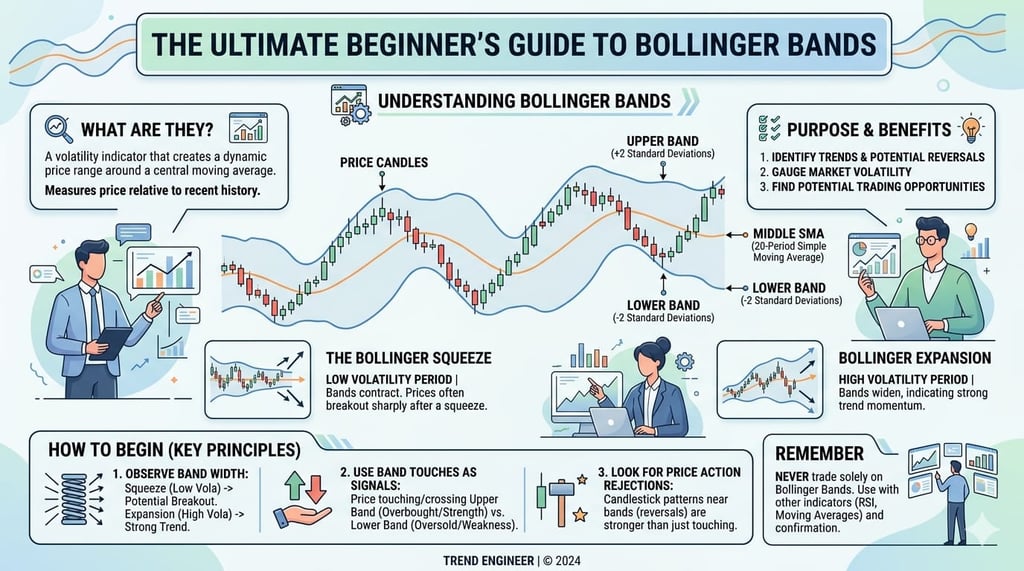
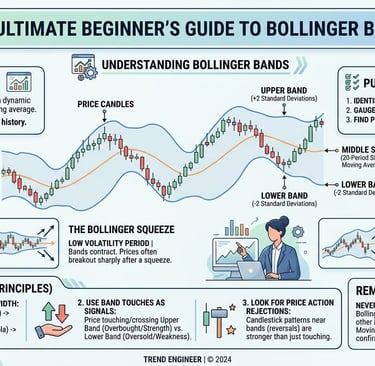
IMAGE 1 DESCRIPTION: This chart shows the three simple lines. A standard blue price line is in the middle. Green represents the Upper Band (Ceiling), red represents the Lower Band (Floor), and the Middle Band is the Average Road.
The tool has three main parts:
The Middle Band (The Road): This is the average price over time (usually the last 20 days).
The Upper Band (The Ceiling): When the price hits this line, the market is stretched high. The stock might be expensive.
The Lower Band (The Floor): When the price hits this line, the market is stretched low. The stock might be cheap.
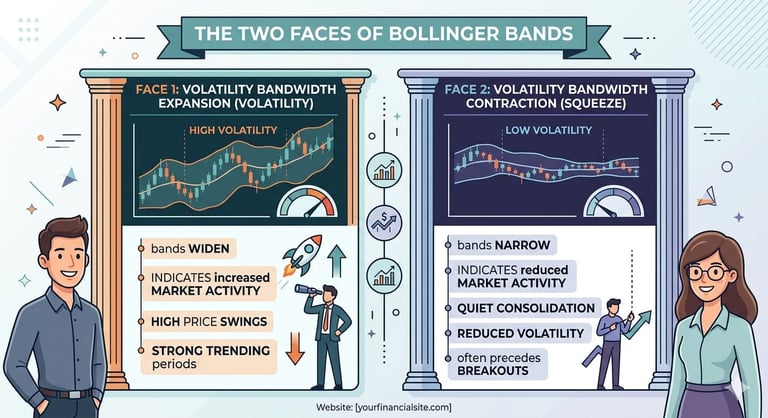
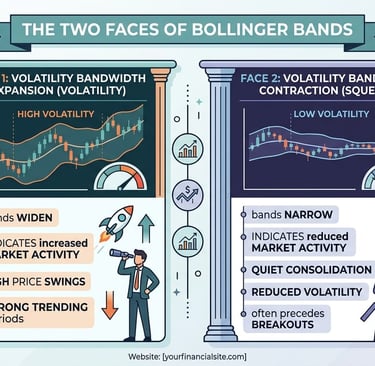
2. The Two Faces of Bollinger Bands
The most important thing to see is how the width of the bands changes. This tells you the mood of the market.
Face A: Low Volatility (The Squeeze)
Sometimes the bands get very thin and skinny, like a tight tube. This means the stock is "quiet," dormant, and not moving much. Watch closely during a squeeze! When prices are quiet, it usually means a massive explosion (up or down) is coming soon.
Face B: High Volatility (The Expansion)
When the bands explode wide open, the market is "loud," crazy, and active. This often happens right after a Squeeze.
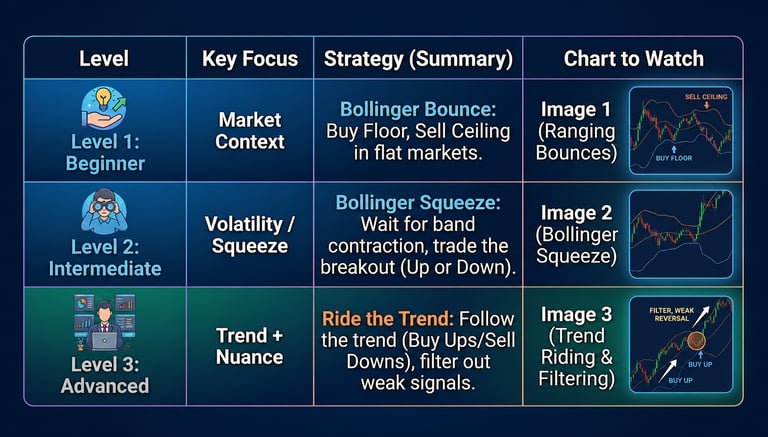
3. Simple Trading Strategy: The Bollinger Bounce
This is the easiest strategy for beginners. It works best when the market is ranging (moving sideways, not trending strongly up or down).
Think of the price like a bouncy ball inside a hallway:
● THE RULE: If the price (the ball) hits the Lower Floor (Lower Band), it is stretched too far. It usually bounces back up toward the middle.
● THE ACTION: Look to BUY near the Lower Band.
● THE RULE: If the price hits the Upper Ceiling (Upper Band), it is stretched too far. It usually falls back down toward the middle.
● THE ACTION: Look to SELL near the Upper Band
4. Intermediate Strategy: Riding the Bands
This strategy is for when the market is trending strongly (moving powerfully in one direction). In a strong trend, the "bounce" strategy will fail. Instead, we use the bands as confirmation.
● Riding Up: If the stock is powerful, the price will "hug" or "walk" the Upper Band. As long as it stays near the ceiling, the uptrend is strong.
● Riding Down: If the stock is crashing, the price will "hug" the Lower Band.
[Image 4: Riding the Bands (Advance Strategy)]
IMAGE 4 DESCRIPTION: This chart shows a powerful series of green (up) candles that continuously touch and follow the line of the Upper Band, which curves sharply upward. This area is labeled 'STRONG TREND (Riding the Band)'.
The Trade: In a strong uptrend, you aren't selling when it hits the ceiling. You are waiting for the price to fall away from the ceiling and close below the Middle Band before you consider selling.
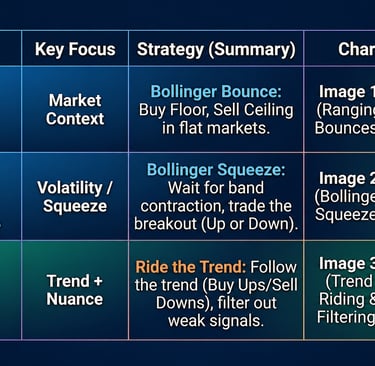
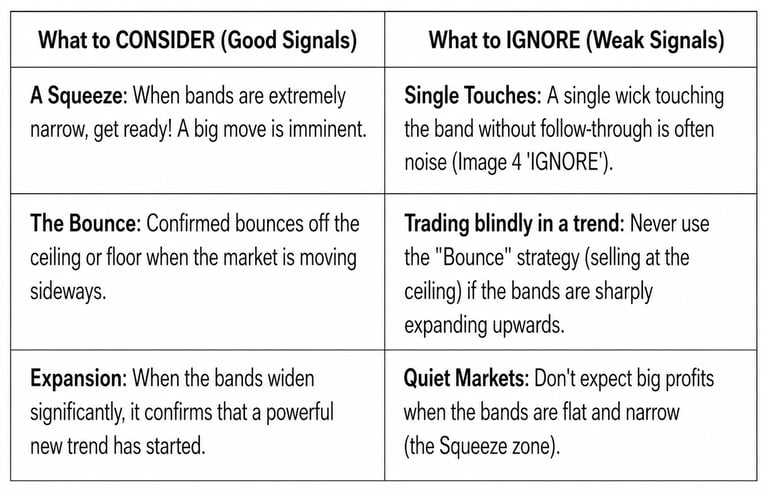
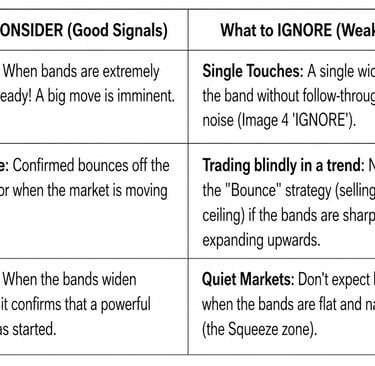
5. Summary: What to Ignore vs. What to Consider
Summary Table: From Beginner to Advanced
Final Thoughts: The Bollinger Rulebook
Why is understanding Bollinger Bands important? Because they provide context. They tell you if the current price is relative to its recent history.
Don’t use them alone: Bollinger Bands are great, but they are better when used with another tool (like RSI or Volume) to confirm the signal.
They are not magic: The price can (and will) crash right through the floor or burst through the ceiling. Use stop-losses!
Practice: Open a demo account and just watch how the bands react to price movement before risking real money.