
What is the MACD?
The MACD is a momentum indicator that shows the relationship between two moving averages of a stock’s price. In simple terms: It tells you if a stock is gaining speed (bullish) or losing steam (bearish).
4/19/20261 min read
What is the MACD?
The MACD is a momentum indicator that shows the relationship between two moving averages of a stock’s price. In simple terms: It tells you if a stock is gaining speed (bullish) or losing steam (bearish).
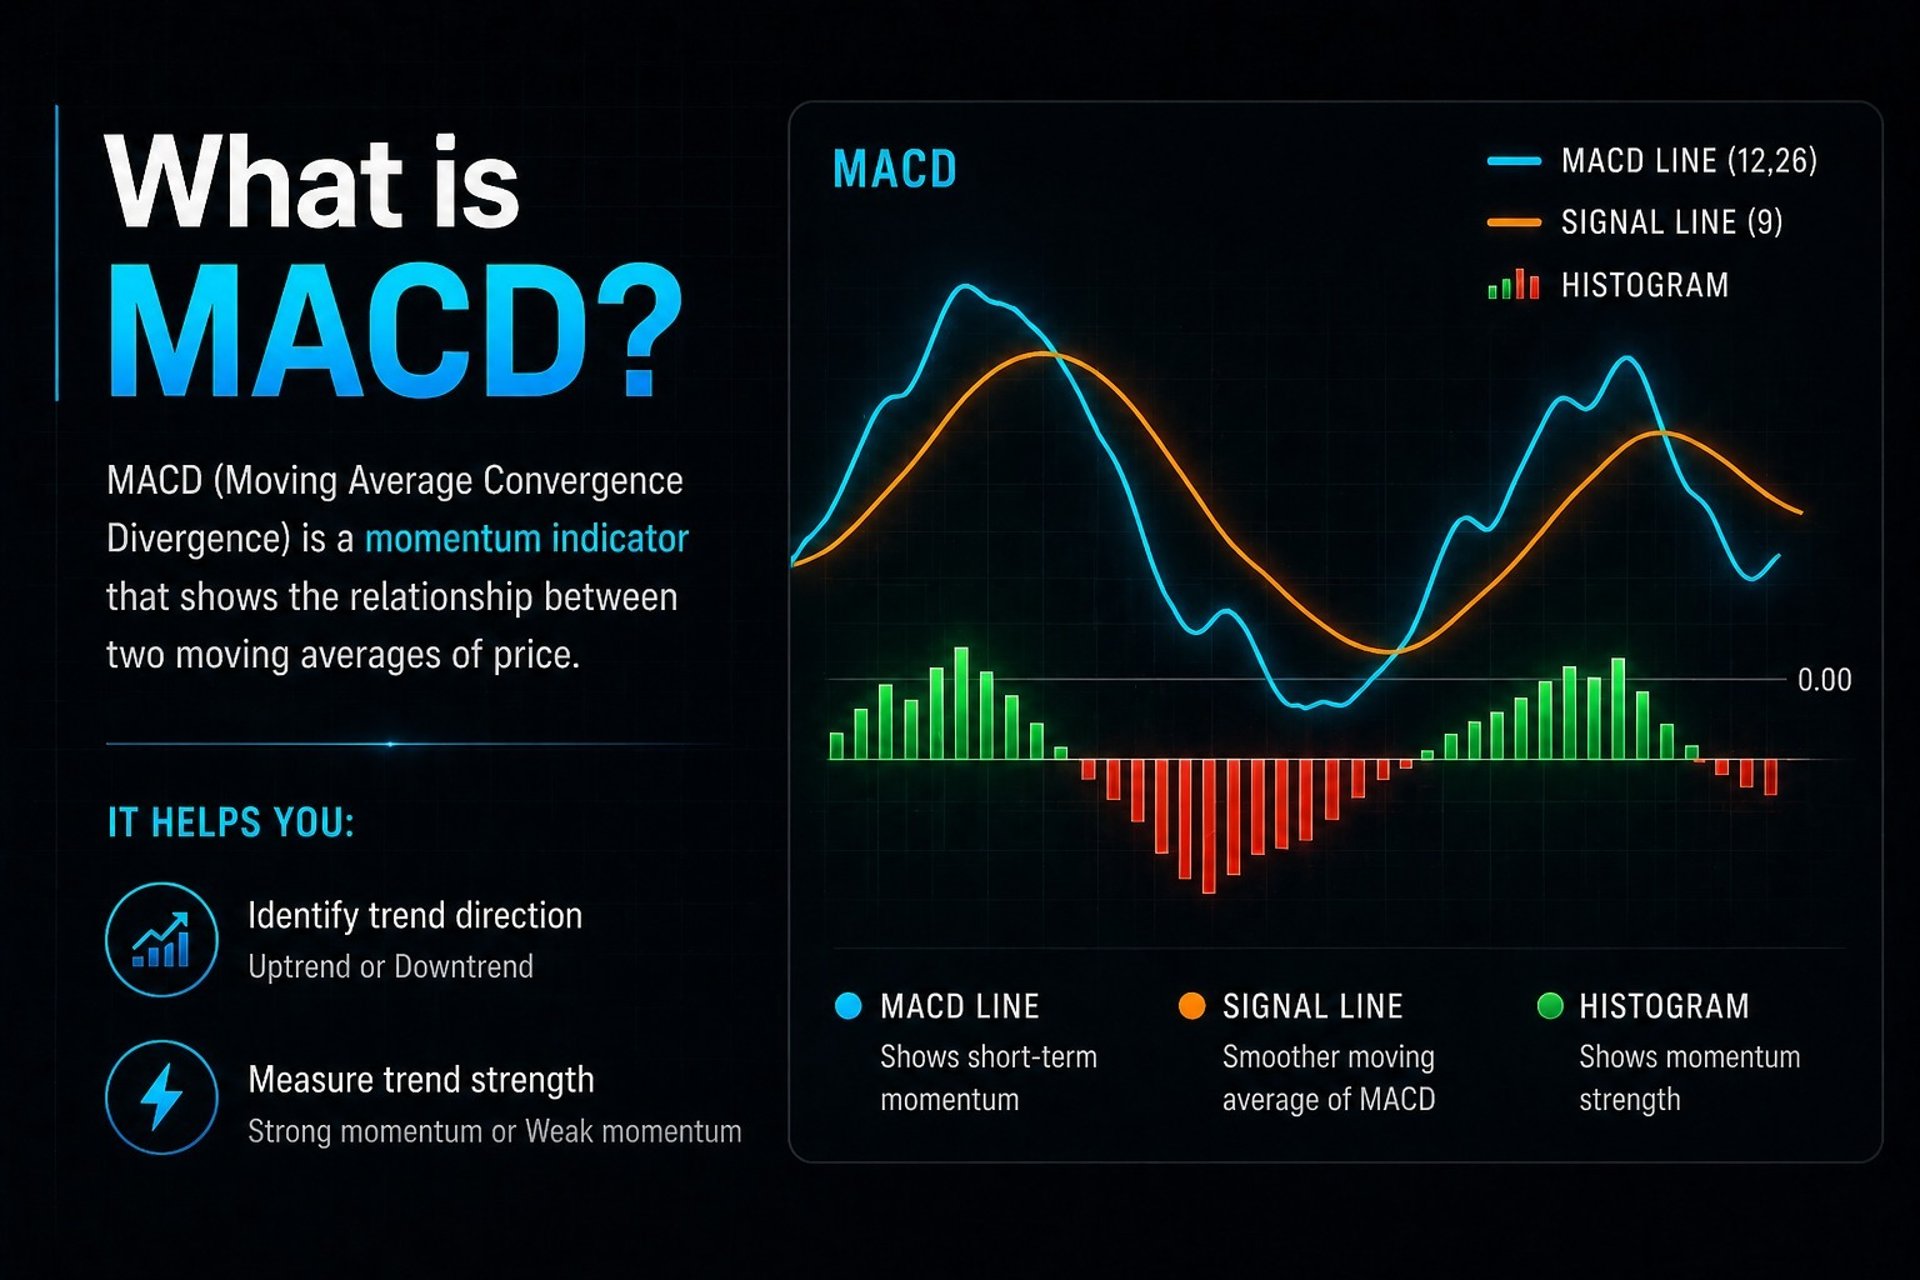
The Three Musketeers of MACD
To understand the chart, you only need to know these three parts:
The MACD Line (Blue): The "fast" line that reacts quickly to price changes
The Signal Line (Orange): The "slow" line that acts as a smoother average.
The Histogram: Those bars in the middle. They show the distance between the two lines. Big bars = Strong momentum!
How to Read It (The "Cheat Sheet")
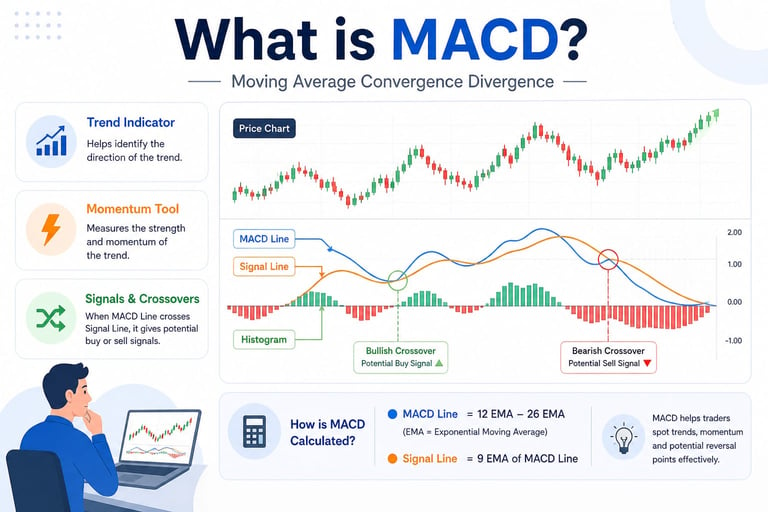
1. The Golden Cross (Buy Signal)
When the Blue MACD line crosses above the Orange Signal line, it’s a sign that the bulls are taking over.
Student Tip: Look for this at the bottom of a downtrend.
2. The Death Cross (Sell Signal)
When the Blue MACD line crosses below the Orange Signal line, momentum is shifting downward.
Student Tip: This is often a "get out" or "stay away" signal.
3. The Zero Line
Above Zero: The trend is generally bullish (positive).
Below Zero: The trend is generally bearish (negative).
Pro-Tip for Students: Don't Fly Solo!
The MACD is powerful, but it can give "fake" signals in a sideways (flat) market. Always pair it with another tool like RSI or Volume to confirm the move.